「vCPM」のすすめ:正しいビュアビリティー広告とは?
Viewability is on the top of every digital marketer’s wish list for 2013. The emerging metric seeks to measure how frequently an ad is actually seen by a user, and not merely the number of times it’s served by a site’s ad server. It’s safe to say that all people (except maybe our cookie bombing friends) agree that viewability is a good thing for the industry and a step toward pulling real TV dollars into our space. Ad networks in particular built their optimization strategies around making sure their cookie was last in line to receive view through credit. Bringing viewability into the mix offers the opportunity to legitimize this often (and rightly) criticized attribution model.
Recently, a spate of articles have examined the various viewability measurement methodologies, outlining the pros and cons of each in order to help marketers determine how to factor viewability into their digital media planning for 2013.
Unfortunately, these articles – and the industry dialogue as a whole – miss a significant point: viewability is a metric that must be evaluated relative to cost in an eCPM, and not just as a percentage of impressions in view. The time has come to add another acronym to our vocabulary: vCPM.
Let’s walk through a sample scenario. Say you have $100K to invest in one of three digital campaigns, and your goal is to purchase viewable impressions for your brand. Your options all cost exactly $100K, and they’re behind three doors:
Door #1: 25MM confirmed views
Door #2: 20MM confirmed views
Door #3: 9.3MM confirmed views
Which campaign option would you choose? If you’re measuring the number of confirmed views, Door #1 seems like a no-brainer, right?
Now let’s say you plan on making your selection based on the percentage of in-view impressions, and that these campaigns offer the following scores:
Door #1: 25% in-view
Door #2: 50% in-view
Door #3: 75% in-view
Still want to proceed with Door #1? A 25% in-view score feels rather abysmal, and I doubt any marketer would happily sign up for a campaign in which 75% of the impressions are served out of view.
But here’s the kicker: percentage of impressions in view doesn’t tell the whole story. Let’s add more campaign details to see how this all comes together. As in real life, each door charges a different CPM, which drastically affects the number of impressions you can buy for your $100K, and that in turn affects the percent of impressions in view:
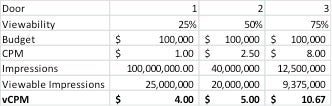
This table should give any marketer pause. Simply selecting an inventory source based on the percentage of in-view impressions can lead you down the wrong path, causing you to spend your way to an inferior ROI. The upshot? Rather than worry about how many impressions are ‘wasted’ by being out of view, focus on how much you pay for impressions that are confirmed in-view. Door #1 is looking pretty good once again!
Regardless of the methodology your publisher or partner uses to measure its viewability, you can still calculate vCPM using this formula:
Total Spend / ((Total impressions * % in-view) / 1000) = vCPM
$100K / ((100,000,000*.25) / 1000) = $4.00
Going forward, marketers need to hold publishers and partners with whom they work, and the tactics they use, accountable to both viewability performance as well as performance relative to cost. The vCPM is the best way to get a truly apples-to-apples comparison of viewability effectiveness.
VCPM is hardly ‘spray and pray’
Now, if you’re wondering whether the vCPM approach is nothing more than “spray and pay” – where marketers go to the ad exchanges in an effort to buy as many cheap impressions as they can and hope for the best – the answer is unequivocally no.
Writing off vCPM as spray and pay implies that higher-priced inventory performs better than cheap inventory as a rule. But is that the case? It is for certain activities, such as credit card signups or consumer electronics purchases. After all, those consumers who are identified as more likely to complete those actions become attractive prospects to more marketers. Over time, competition for the impressions served to those consumers heats up, leading to an escalation in price. That’s why In-Market or Remarketing tactics earn comparatively high CPMs.
But, we don’t have a third-party data segment called ‘In-Market for Viewable Impressions.’ Viewability is a performance activity that can be found across the entire digital sphere, in impressions delivered to all kinds of consumers visiting all kinds of sites. As a result, “viewable” impressions aren’t inherently more expensive, just as expensive inventory doesn’t have an inherent vCPM advantage (as will be discussed below).
What’s more, because the measurement is still evolving, deciding at bid time whether an impression will be in-view remains an inexact science. In this light, one could even argue that the cheap spray and pray approach offers a better path to vCPM success than its more expensive alternative, “pay and pray.”
Why expensive inventory doesn’t always have a vCPM advantage
The viewability metric is different from other performance activities in another key way: those activities are limitless, whereas viewability is capped at 100%. To use a sports comparison, think of bowling: no matter how skilled your opponent, he or she can only score a 300. Likewise, the most expensive, premium inventory on the web can only achieve a maximum 100% in-view.
Using our campaign option examples above, let’s pretend that Door #3 was actually 100% in-view and therefore delivered an $8.00 vCPM. Even with perfect in-view performance, the burden of Door #3’s significantly higher cost allows both Door #1 ($4.00 vCPM) and Door #2 ($5.00 vCPM) to be significantly more cost effective. More simply put: the marketer who bought Door #3 is paying more for each viewed impression, and getting fewer of them.
Viewability performance, like all performance metrics, should be evaluated relative to cost
Without including cost in your performance equation, there is no way to fully understand and optimize the viewability of your media plan. Furthermore, smart marketers will recognize that this metric is but one of many metrics that matter. The task of optimizing advertising ROI is a multivariate problem, and the modern marketer needs an approach and supporting tools that enable them to not only isolate and test variables, but also to pull it all back together in an automated way that weighs the various sensitivities and trade-offs for the best result for their brand. Marketers who get this, and jump up the learning curve quickly to solve for multivariate advertising ROI will be the biggest winners in 2013, and the years to come..